The global standard
for Edge AI
Stream Analyze enables teams to develop, deploy, monitor and operate Decision Intelligence on the Edge.
READ MORE
Stream Analyze enables teams to develop, deploy, monitor and operate Decision Intelligence on the Edge.
READ MORE
Stream Analyze enables teams to develop, deploy, monitor and operate Decision Intelligence on the Edge.
READ MORE
Stream Analyze enables teams to develop, deploy, monitor and operate Decision Intelligence on the Edge.
READ MOREStream Analyze announces new leadership and investment.
READ MORE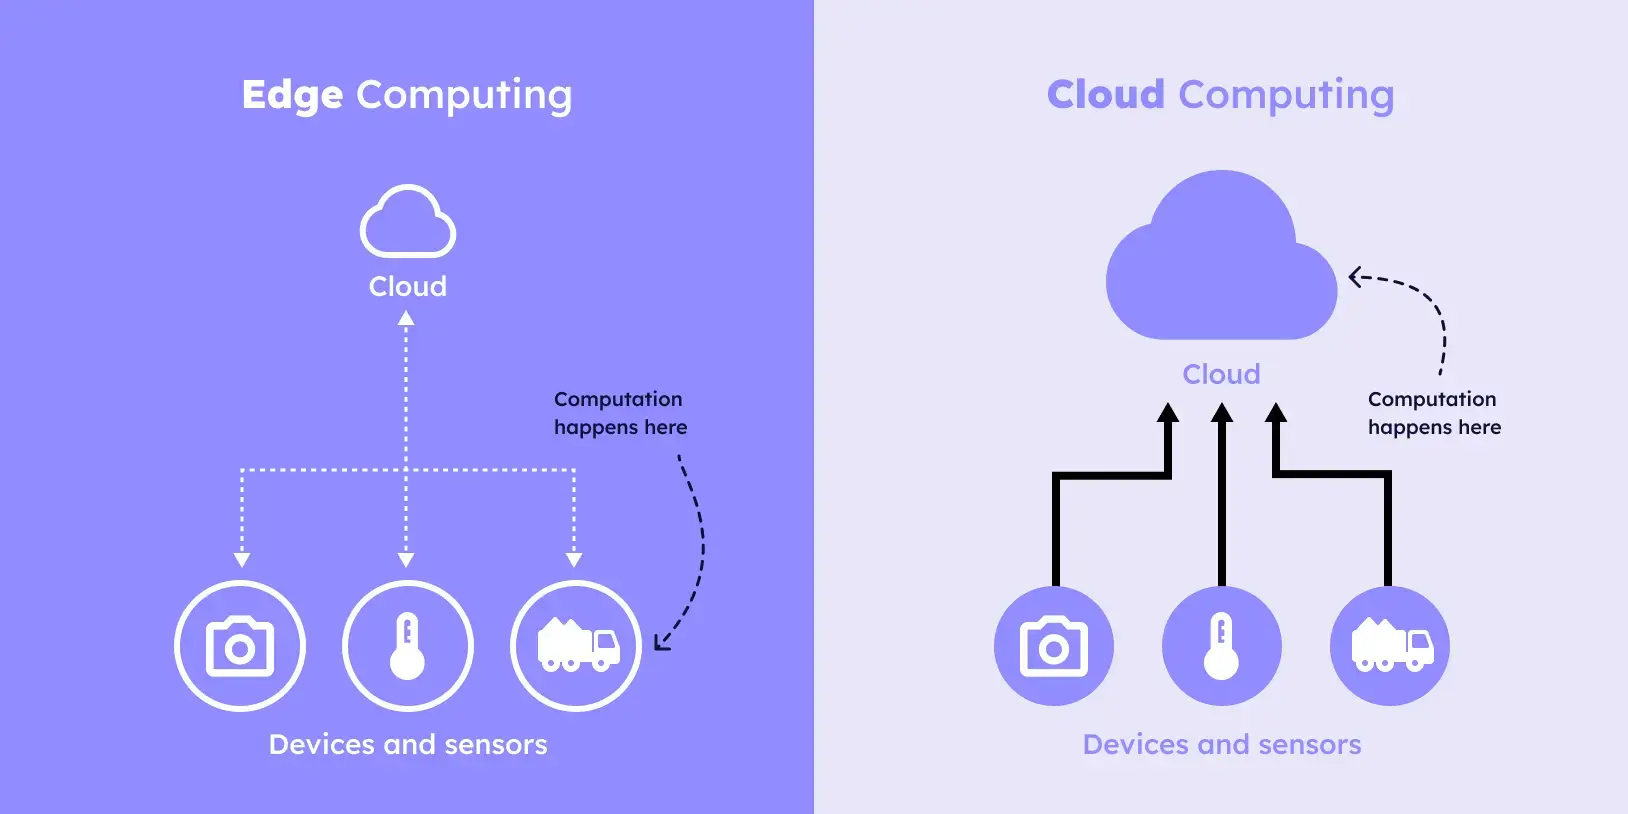
Imagine a world where data works faster than you think—where insights aren't delayed by cloud journeys, and decisions aren't stalled by slow and expensive connections.
READ MORE
The surge in connected devices has unleashed an unprecedented explosion of data, most of which is processed and stored in massive cloud data centers.
READ MORE
A leading robotic mower company adapts to digital servitization to meet growing customer demand.
READ MORE
A global OEM aims to infuse AI into its outdoor power products, with innovation and external IT expertise.
READ MORE
A tooling company seeks to enhance customer value by predicting battery life, as a novel service model.
READ MORE
Case Study
